
Tournament Leaderboards and Points Tables — Keeping Score Properly

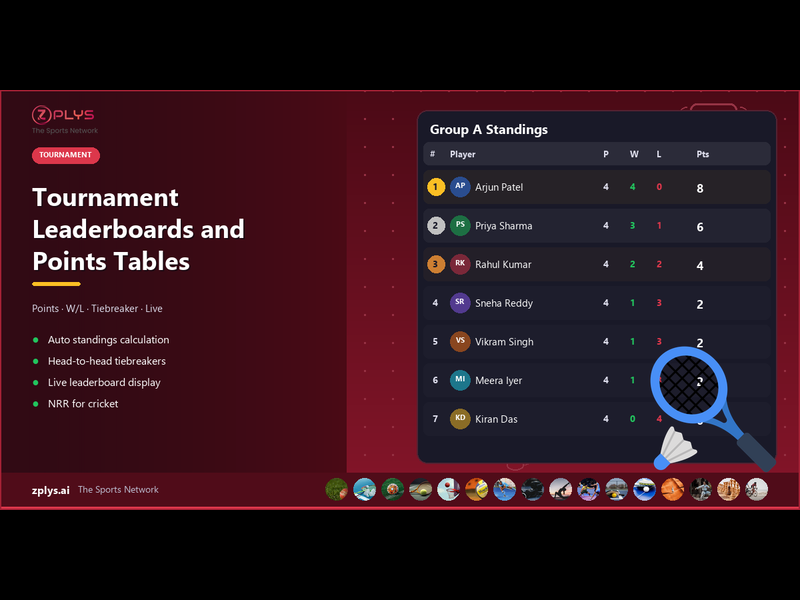
The points table is the most checked, most disputed, and most manually error-prone element of any group-stage tournament. Every player refreshes it after their match. Every team captain examines it to calculate qualification scenarios. And every organizer dreads the moment when someone points out that the standings are wrong.
Getting the leaderboard right is not just about math. It is about transparency, speed, and trust.
Points Systems That Work
For Individual Sports (Badminton, Tennis, Pickleball)
The standard points system for group stages:
Win: 2 points
Loss: 1 point
Walkover received (opponent no-show): 2 points
Walkover given: 0 points
No show from both: 0 points each
Why give 1 point for a loss instead of 0? Because it prevents a player who has already lost two matches from withdrawing — they still have something to play for. Walkover-givers get 0 to penalise no-shows.
For Team Sports (Cricket, Football)
Win: 2 points
Tie/Draw: 1 point each
Loss: 0 points
No Result (abandoned): 1 point each
Bonus point (optional): 1 extra point for winning by a large margin (e.g., winning by 50+ runs in cricket, scoring 5+ goals in football)
The bonus point system rewards dominant performances and discourages teams from coasting after securing qualification.
Tiebreakers — The Part Everyone Gets Wrong
Two teams with equal points at the end of the group stage. Who goes through? This is where arguments happen, because most organizers do not define tiebreaker rules in advance.
Establish and communicate these BEFORE the tournament starts:
Standard Tiebreaker Hierarchy
Head-to-head result: who won when the tied teams played each other?
Game/set difference: total games (or sets) won minus total games lost. A player who won 2-1, 2-0, 2-1 has a game difference of +4. A player who won 2-0, 2-0 but lost 0-2 also has +4. Equal? Move to...
Points difference: total points scored minus total points conceded across all group matches.
Points scored: higher total points scored (rewards attacking play).
Coin toss or drawing lots: the last resort. Nobody likes it, but it is better than a 30-minute argument.
For cricket specifically: net run rate (NRR) is the standard second tiebreaker after head-to-head. NRR = (total runs scored / total overs faced) minus (total runs conceded / total overs bowled). This is a standard calculation but error-prone when done manually — get it wrong and you face legitimate complaints.
Live Leaderboard — Why It Matters
A leaderboard that updates after each match, visible to all players, does three things:
Keeps players engaged. Between matches, players check the standings, calculate scenarios, and discuss outcomes. This engagement keeps them at the venue instead of leaving after their match.
Builds transparency. When the standings are visible and update in real time, there is no suspicion of manipulation. Every point, every game difference, every tiebreaker calculation is visible.
Reduces disputes. Most standing-related disputes arise from delayed or incorrect updates. When the leaderboard updates instantly after a score is entered, disputes disappear — the numbers speak for themselves.
The Manual Leaderboard Problem
Updating a points table manually on a whiteboard or spreadsheet has predictable failure modes:
Calculation errors in game difference (adding instead of subtracting, or using the wrong denominator for NRR)
Delayed updates (the last match of the group finished, but the standings are not updated for 20 minutes while the desk is busy)
Inconsistent tiebreaker application (using points difference for Group A but head-to-head for Group B because the desk volunteer did not know the rules)
Illegibility (rain-smudged whiteboard, tiny spreadsheet printout)
A tournament management platform eliminates all of these. When a match score is entered, the standings update automatically: points, game/set difference, point difference, NRR (for cricket), and tiebreaker ranking. The leaderboard is visible on the tournament page, the venue display, and each player's phone.
Setting Up Your Leaderboard
Before the tournament, configure:
Points allocation (win, loss, draw, walkover)
Tiebreaker order (head-to-head first, then difference, then scored, then lots)
Qualification criteria (top 1, top 2, or best third-place finishers across groups)
Display settings (what columns to show — played, won, lost, drawn, points, difference)
Most platforms like Zplys let you configure all of this when creating the tournament. Once set, the system handles every calculation automatically for the entire event.
Group Stage to Knockout Transition
The moment group stages end and the knockout bracket must be populated — this is the highest-stress moment for any organizer using manual systems. You need to:
Finalize all group standings (confirm no score corrections pending)
Apply tiebreakers where needed
Slot group winners and runners-up into the bracket (avoiding same-group players meeting in the quarterfinals if possible)
Communicate the bracket to all players
Schedule the first knockout round
With software, this happens in seconds. Group stages end, scores are confirmed, and the bracket populates itself based on pre-configured seeding rules. The bracket appears on every player's phone. The first knockout match is scheduled. No whiteboard redrawing, no manual seeding discussions, no 30-minute delay while the organizer works out who plays whom.
After the Tournament — Statistics and Records
A well-maintained leaderboard gives you tournament-level statistics that players and sponsors value: most wins, best game/point difference, longest winning streak, highest individual score (cricket), most aces (tennis/badminton), and player-of-the-tournament metrics.
Share these statistics within 24 hours of the tournament. Players love seeing their name in a statistics table. Sponsors appreciate the data for measuring engagement. And you have a historical record that helps with seeding and organization for the next edition.